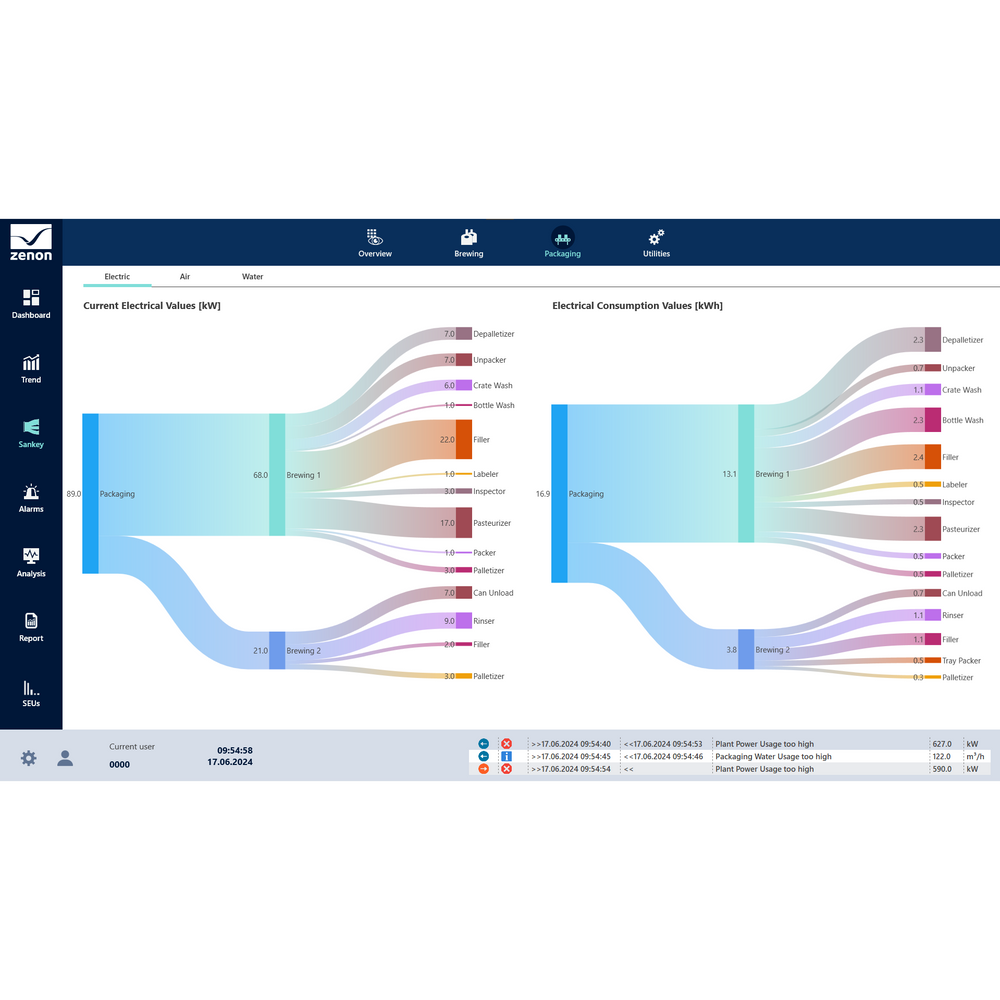
Get quick insights into the distribution of comparable data. This can be consumption cost by media, summary of different alarms per alarm groups or alarm classes, production performance by product type or other KPIs.
The donut chart displays up to four variable values