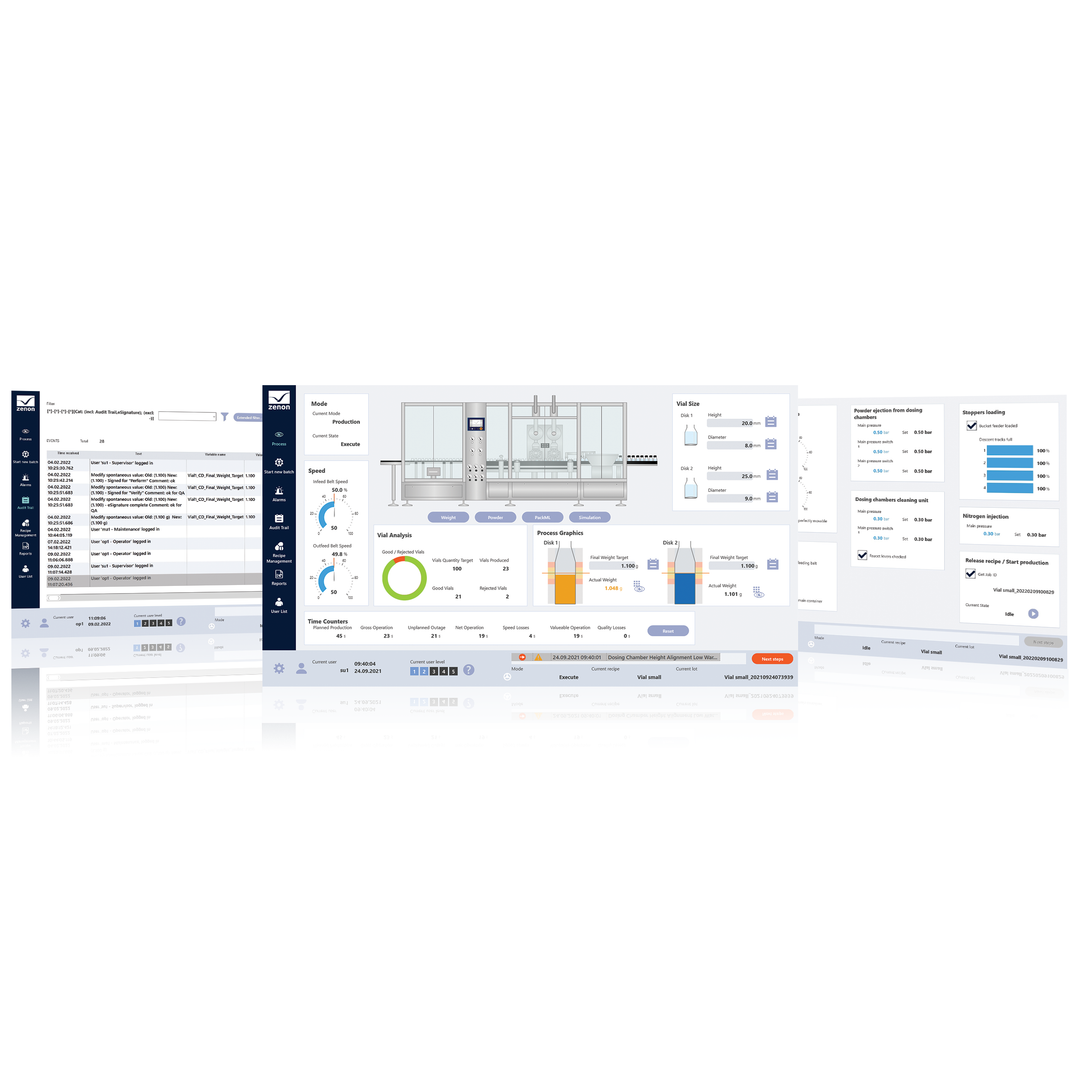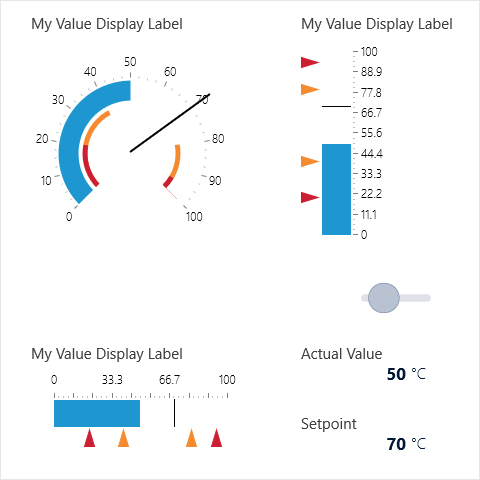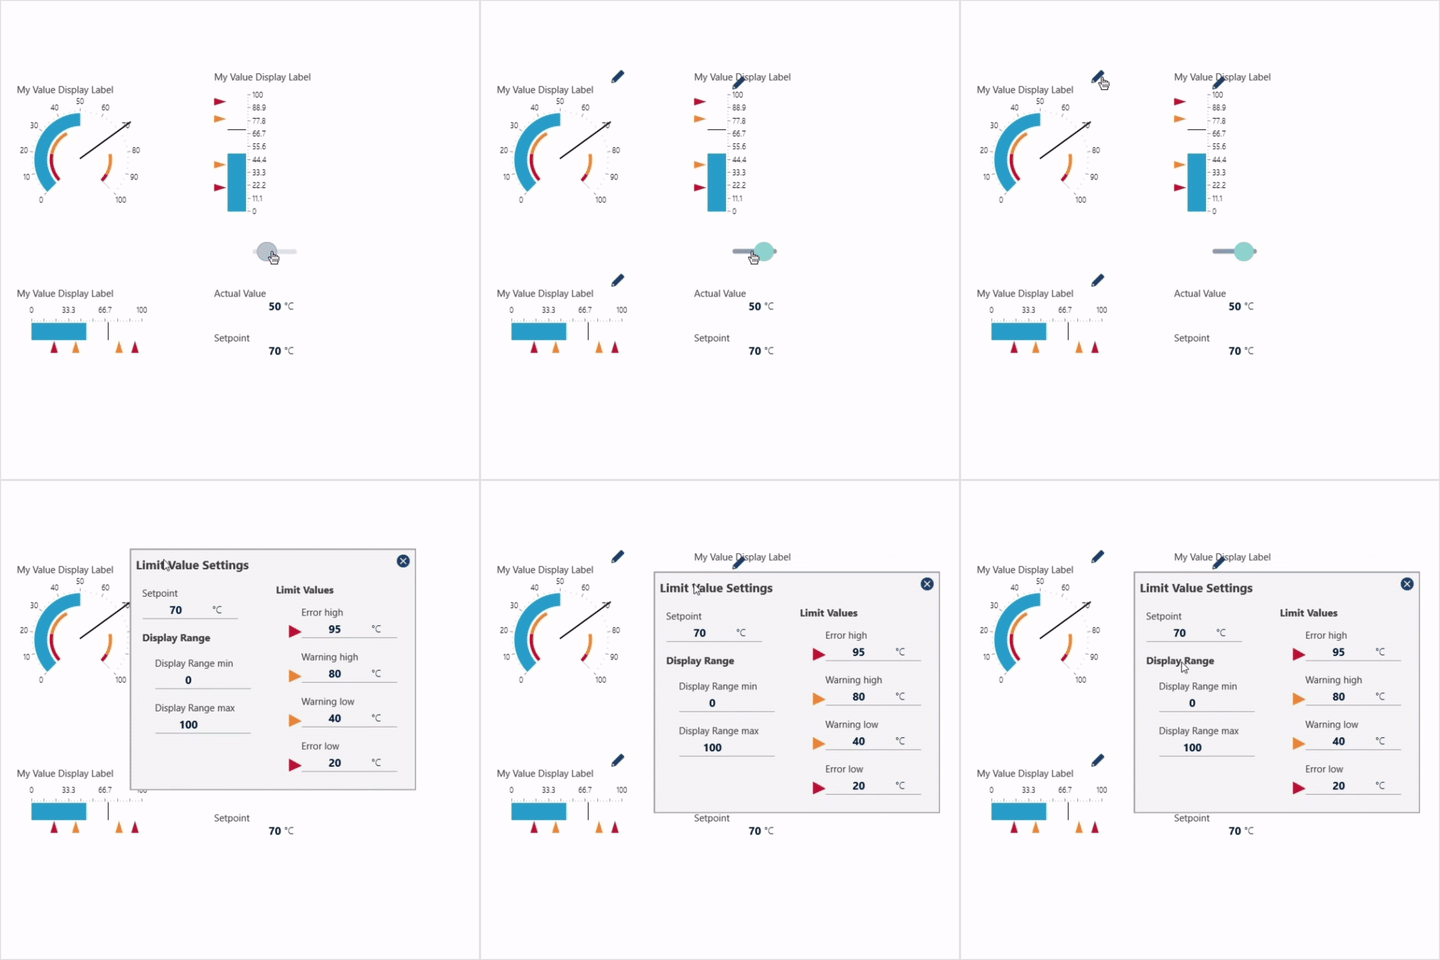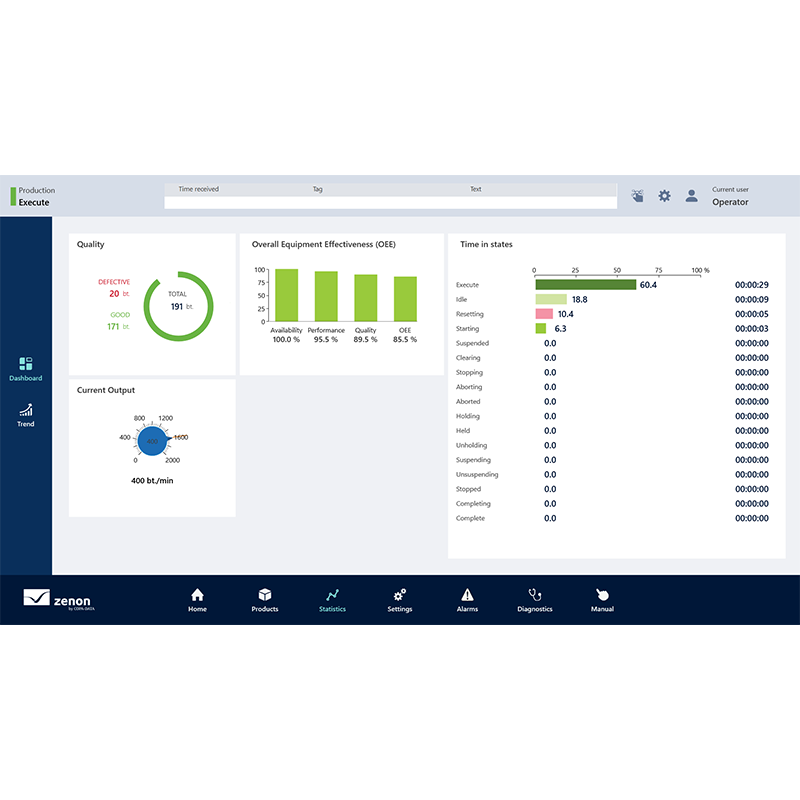

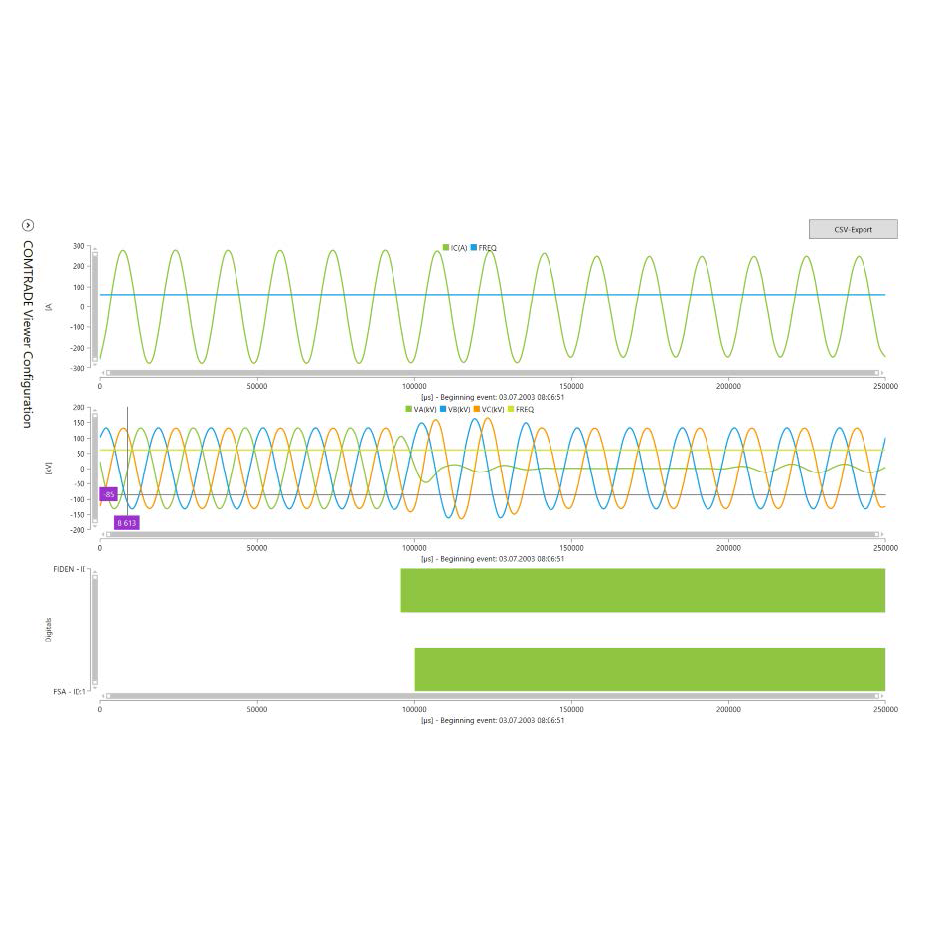
The Comtrade-Viewer is for the graphical analysis of digital error and result logging of a COMTRADE file.
- Selection of a file in the COMTRADE file format
- Visualization of the selected COMTRADE file
- The display colors can be configured in the zenon Engineering Studio (formerly named Editor).
- Current (sinus wave display)
- Voltage (sinus wave display)
- Digital signals (binary bar chart display)
- Display of values at a selected cursor position.
- If an element that represents neither current or voltage is selected, (such as frequency), this is visualized in both analog areas again (current and voltage).
- Navigation
- Zoom in and zoom out using the mouse wheel, scroll bar and Multi-Touch gestures
- Enlargement of the area Selection of the area by clicking the mouse
- Move the display area using the right mouse button, scroll bar or Multi-Touch gestures.
- Exports selected objects as an CSV file.